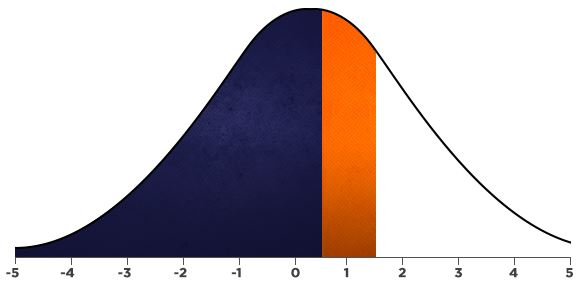
Standard deviation is the measure of spread, which is usually used in statistic and statistical practice when the mean is being used to calculate the central tendency. Thus, it helps in measuring the spread around the mean. Since it is connected close to the mean, It can be highly affected if the mean will give a poor measure of the central tendency.
Standard deviation is greatly influenced by the outliers, and even the tiniest values can largely contribute to the outcome of the standard deviation. This means that through the standard deviation, One can indicate the presence of outliers. This is how standard deviation can be a very useful measure of spread in terms of symmetrical distributions without any outliers. It is also useful when you are comparing the spread of two different data sets that have almost the same value of the mean. The data set that has a small standard deviation will have a narrow spread of measurement around the mean when compared to the set that has a larger standard deviation. This is why they have either high or low values. When you select a data randomly from the data set, and if its value is low, then it has a better chance of being close to the mean when compared to an item which will have a high standard deviation.
How to Calculate Standard Deviation and Variance and Formula?
Let make it a little simple for you. Standard deviation is the measurement of how spread out the numbers is, and the symbol is σ. The formula is quite simple to remember- you have to square root the variance to get the standard deviation. But, the question is, “What is variance?”
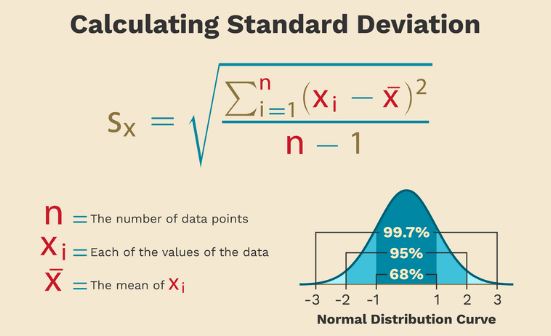
Variance is the average of the squared differences obtained from the mean. How can you calculate Variance? Given below are a few steps which will make it easy for you:
- First, find the mean of the numbers or values given (which is to find the average of all the numbers)
- Then for each given number- subtract the mean first and then square the outcome (this is known as squared difference)
- Now, work out the average of the squared difference that you just obtained.
Example:
1.You and your friends have measured the height of different bottles (in millimetres):
The heights for 5 bottles are 100mm, 70mm, 75mm, 80mm, and 50mm.
Now what you have to do is first find the mean, then the Variance and lastly, Standard deviation. To find Mean:
Add 100mm, 70mm, 75mm, 80mm, and 50mm and divide it by 5. Your answer will be 75mm. Now to calculate the variance, take each difference, square it, and then average the result that you obtain.
2. Find the standard deviation of 4, 9, 11, 12, 17, 5, 8, 12, and 14.
First, work out the mean: 10.222.
Now, subtract the mean individually from each of the numbers given and square the result. This is equivalent to the (x -) ² step. X refers to the values given in the question.
| x | 4 | 9 | 11 | 12 | 17 | 5 | 8 | 12 | 14 |
| (x -)2 | 38.7 | 1.49 | 0.60 | 3.16 | 45.9 | 27.3 | 4.94 | 3.16 | 14.3 |
Now add up these results (this is the ‘sigma’ in the formula): 139.55
Divide by n. n is the number of values, so in this case, n is 9. This gives us: 15.51.
Finally, square root this: 3.94
You can use a calculator to find the square root of the above-mentioned value as it is easy and a few exams even allow the use of a calculator.
Properties of Standard Deviation:
When you use standard deviation, you have to keep the following points in mind:
- It is used to measure spread or dispersion around the mean of a given data set.
- It can never be negative in value.
- As already mentioned, the standard deviation is greatly influenced by the presence of outliers. A single outlier can either lower or raise the standard deviation, and in turn, disturb the entire picture of the spread.
- In case of data sets that have approximately the same mean, the greater the spread, the higher the value of standard deviation.
- In case all the values of a data set are similar, the value of standard deviation will be zero as each value is equal to the given mean.
Formula:
The variance for a discrete variable is made up of n observations and is defined as follows:
![]()
Or,
![]()
Frequency Table:
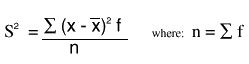
The formulas for variance and standard deviation can change if you frame the observations in a frequency table. After this, the squared deviations are supposed to be multiplied by each frequency value, and then the result is calculated from the total of these observations.
The variance in the frequency table can be defined as follows:
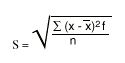
The standard deviation for a discrete variable is defined as
It will be helpful if the measure has the following properties:
- The measure should be in proportion to the scatter of the data. This means that it will be small if the data is clustered together and large when they are broadly scattered.
- The measure should be not dependent on any of the values or numbers of the data set. If it is dependent, the value will increase even when the measurement scatters is not increasing.
- The measure should be independent of the mean because your focus right now is the spread of the data and not its central tendency.
What is the Standard Error?
While you are conducting research, It will not be possible for you to collect data from the entire population. This is why you will collect data only of a small sample of the entire population, and because of this, you might end up with slightly different values and means each time. But, when you take enough samples, you will get proper mean value.
Also, the standard deviation of this entire distribution is known as the standard error. It will tell you the accuracy of the mean at any given point of time. In case of the standard error increases, the means will also spread out.
Read More – Capital Budgeting Analysis

Krishna Murthy is the senior publisher at Trickyfinance. Krishna Murthy was one of the brilliant students during his college days. He completed his education in MBA (Master of Business Administration), and he is currently managing the all workload for sharing the best banking information over the internet. The main purpose of starting Tricky Finance is to provide all the precious information related to businesses and the banks to his readers.